iTrek Z1 GPS datalogger precision test
The iTrek Z1 datalogger GPS with a solar panel is based on the MTK chipset produced beginning in Q1 2007. I brought this GPS data logger, along with three other GPS units, on an ethnoarchaeological research project in Peru in 2007 where we travelled with a traditional salt-bearing caravan for 14 days, and I gathered 9 days of data logging with the iTrek Z1. I conducted this test to evaluate the precision of the GPS in the southern hemiphere where there is no WAAS.
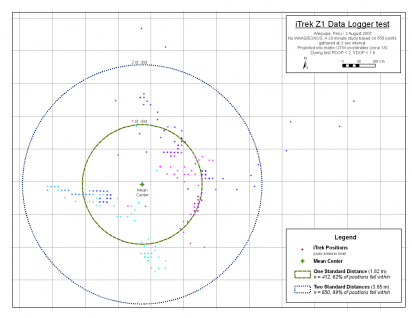
This page shows the results of a test in Arequipa, Peru in August 2007 where WAAS (SBAS DGPS) correction is not available. The test location is at -16.3989, -71.5511, 2370 masl. During testing PDOP was <2, and VDOP <1.6. The GPS was placed on a rooftop for ~30 min and was set to a three second sampling interval. The resulting 660 points were brought into ArcGIS 9.2 and the first and last two records were deleted because they were anomolous. Using the remaining 656 positions, the test showed that 62% (1 standard distance) of the positions fell within 1.82 m of the central point while 99% (2 standard distances) of the positions fell within 3.65m of the central feature. Good results for a $70 low-power device. |
 |
Steps in the analysis
1. Bring data from iTrek Z1 to Arcmap 9.2 UTM (metric units)
- Import CSV table into Arcmap as WGS84 Lat/Long
- Reproject into UTM coordinate system (zone 18 south)
2. Horizontal Distance error distribution (ArcGIS Spatial Statistics)
- Use Mean Center to calculate a central position in the point cloud. The Mean Center is the average X and Y coordinate for all the features in the study area.
- Calculate one and two Standard Distances.
- Count the positions that fall within one and two Standard Distances
3. Vertical Distance error distribution
- Using elevation for each record: Error_Z = ABS ( MASL - Mean(MASL))
Results
| 1. Mapped results (Browser) or see results as a PDF |
Note that as it originates as two dimensional data (distance in X and Y) the variance in horizontal position is evaluated using the Standard Distance measure rather than Standard Deviation. A technical article describing Standard Distance is
Standard Distance in Univariate and Multivariate Analysis, Bernhard K. Flury and Hans Riedwyl. The American Statistician, Vol. 40, No. 3 (Aug., 1986), pp. 249-251.
Note one dimensional descriptive statistics like Standard Deviation are problematic with two dimensional data and hence the need for tools like Standard Distance in a GIS context, as shown above.
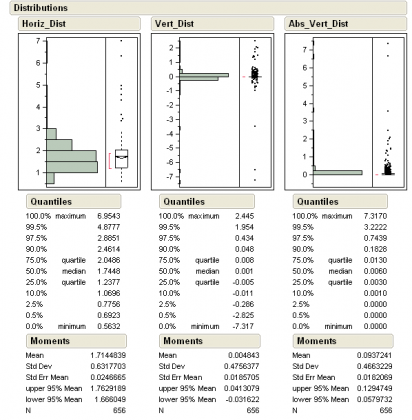
Horizontal distance, Vertical distance, Vertical Absolute value distance
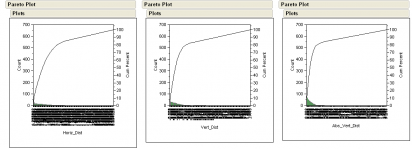
3. The Pareto cumulative frequency plots of the deviation from the mean center.
4. The 656 record data logger table in Excel format with distance mean appended.


