5.4.4. Survey design
The Upper Colca Project survey goals emphasized investigating the Chivay source area, the geological contexts for obsidian formation, and the principal areas of human settlement within one day's walk from the source. In the implementation of the survey, high-likelihood areas in the obsidian source zone were evaluated using a prospection survey. This included a careful survey of the entire Maymeja area itself and large portions of the southern rim using a surveyor interval of 15m.
|
Source |
Institution |
Scale / Res. |
Comments / Application |
|
ASTER imagery |
NASA, JPL(Abrams, et al. 2002) |
15m |
Visual and NDVI analysis |
|
ASTER DEM |
NASA, JPL(Abrams, et al. 2002) |
30m |
Representation, slope calculation |
|
SRTM DEM |
NASA, USGS, CGIAR (Jarvis, et al. 2006) |
90m |
Regional relief mapping |
|
Aerial photos |
Servicio Aerofotográfica Nacional, Perú |
1:60,000 |
Historic aerial photos. |
|
Topographic maps |
Instituto Geográfica Nacional, Perú |
1:100,000 |
Features, toponyms (PSAD56), scanned |
|
Geology maps |
INGEMMET, Perú |
1:100,000 |
Geology (PSAD56), scanned |
|
VMAP1 |
NIMA (1995) |
1:250,000 |
Regional map |
|
VMAP0 |
NIMA (1995) |
1:1 million |
Continental map |
Table 5-4. Digital data sources used in developing the survey strategy.
Selection of survey regions involved the use of a number of spatial data sources (Table 5-4), as well as interviews with local residents, personal visits, and consultation of previously published reports. Preliminary field visits with a Trimble Geoexplorer GPS in 2001 and 2002 involved collecting ground control points and GPS lines on major roads and other features. After post-processing using the AREQ base station (International GPS Service), these data permitted the georeferencing of aerial photos and scanned maps directly to the GPS acquired data.
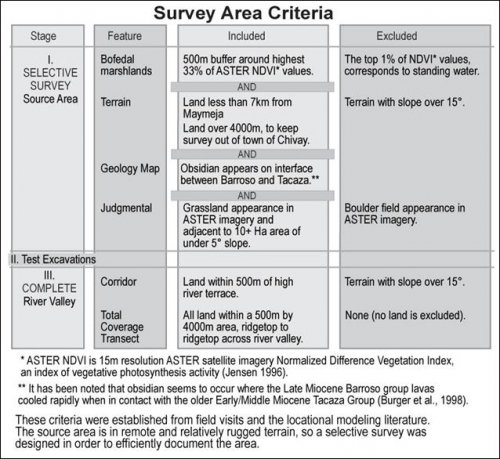
Figure 5-1. Criteria in designing regional survey from three stage research proposal including obsidian source survey, testing program, and concluding with the river valley survey.
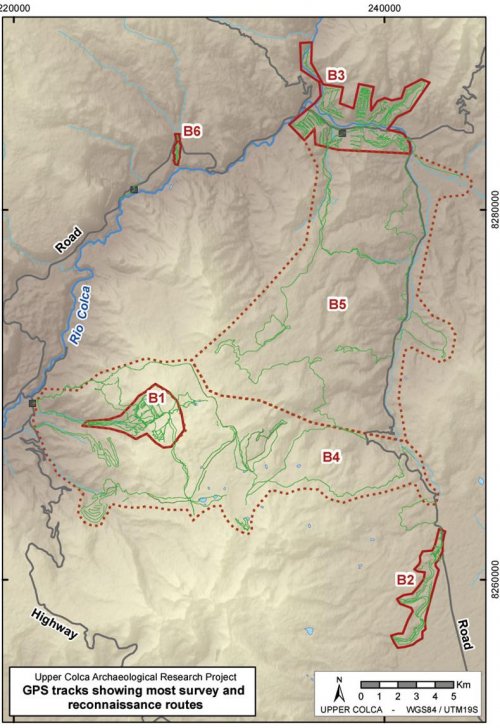
Survey in the area of the obsidian source, outside of the Maymeja depression itself, was selective as it focused on high likelihood areas. Survey coverage in the Blocks 2 and 3 zones was contiguous with a 15m surveyor interval although here the survey region was delimited by other criteria. First, in the Block 2 (San Bartolomé area) a particular strip of land was targeted that paralleled the terminus of a Barroso lava flow. The survey block was surveyed 100% at 15m intervals along this densely occupied region. In Block 3, a maximum steepness and distance to river criteria was used to concentrate survey efforts to the river corridor region. Thus, in Block 3, all lands were surveyed within 500m of the high river terrace above the principal drainage (Colca, Llapa, and Pulpera drainages), and terrain over 15° slope (33% slope) were not surveyed. This maximum steepness limitation excluded many eroded regions where preservation is poor, but it also excluded a number of areas that were perhaps occupied. In order to evaluate the survey criteria in Block 3, a swath of land 1 km wide by 3 km long was surveyed at truly 100% coverage at 15m interval, and these areas could then evaluated to gauge the effects of the survey criteria used elsewhere in Block 3 that excluded the high slope and non-riverside areas. This 100% survey test swath will be described in more detail below.
Figure 5-2. GPS tracks from edges of most survey routes showing emphasis on Blocks 1, 2, 3 and 6.
With GPS units the survey coverage and spatial sampling is made relatively explicit, permitting future researchers in the region to focus on areas that were under-investigated in the 2001, 2002 and 2003 survey efforts. With GPS track loggers becoming easily available, explicit coverage reporting will likely be more widely adopted in the future.


