5.5.6. Variability within a Locus
A basic complexity of archaeological survey is that artifact concentrations frequently contain a variety of artifact types, perhaps dating to completely different occupations. This variability presents a particular challenge for a fast, mobile GIS based recording system because in lieu of sampling, all that the archaeologist has time to do is to document his or her rapid assessment of the artifacts that are found within individual loci geometry mapped into the GIS. Additionally, despite of the variability present within the locus, the archaeologist must attempt to generate data over the course of the field season that are consistent and comparable. During the Upper Colca Survey this difficulty was addressed by estimating the characteristics of a primary and secondary attribute category, dubbed Category 1 and Category 2 (see Figure 5-5b), that best characterizes the locus using the custom interface developed for the project.
The problem: How does one evaluate and map a scatter of, say, 5,000 stone flakes in less than one hour, as well as estimate the percentage of obsidian to another material type, such as chert?
In order to achieve statistical rigor and reliability, a sampling strategy was needed. Sampling and collecting artifacts is time consuming, and sampling at every concentration of lithics near a quarry is also unrealistic because there are so many lithic artifacts in such areas. Sampling was therefore carried out at "High Density Loci" with artifact concentrations deemed most worthwhile given the research goals, while a less rigorous approach was applied for artifact distributions of lesser importance. A solution was devised that is geared for conducting cursory inventory, not an in-depth assessment. This solution captured variability by estimating the proportions of the two dominant attribute categories within a given polygon.
(a) (b)
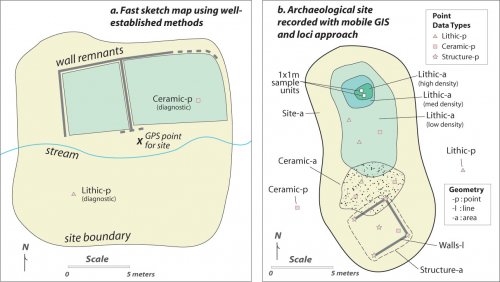
Figure5-6. Maps for two different hypothetical sites recorded in less than one hour. (a) A conventional, low precision sketch map showing only major site features and perhaps subdivided into site sectors (b) Mobile GIS site map with 1-2m dGPS error. Internal distributions, such as the fried-egg density gradient model shown here, can be assessed and rapidly mapped.
(a) (b)
Figure 5-7. (a) Structure of the archaeological Shapefiles with names and descriptions. Each of the Shapefiles had a form associated with it that prompted the user with fields appropriate to that data type. (b) An example of a part of the ID # system that prioritizes spatial provenience in the field.
A hypothetical site description makes the site recording strategy more clear. This example takes place at a site with a large, low-density lithic locus (Figure 5-6b), where the concentration of stone artifacts was mostly obsidian material but also included artifacts made from chert, chalcedony, and quartzite. The mobile GIS user walks around the locus with the GPS running, and the area was recorded into the "Lithics-A" ShapeFile (Figure 5-7a). Lithic concentrations of medium and high density are found inside the locus, creating a 'fried-egg' density map. Subsequent to delineating the locus with a GPS, the custom form (Figure 5-5b) appears. Several steps are followed in filling out the form.
(1) The primary "axis" of variability is determined. In this case, it is stone material type.
(2) Using this variable, the largest group is characterized. This attribute category 1 (C1) was described as "Material: Obsidian," and other attributes of interest to lithic analysis such as amount of cortex, size of debitage, and artifact density in the attribute category, were rapidly estimated. In our case, the density was "Low."
(3) The second most represented group, attribute category 2 (C2), is characterized and its attributes are evaluated, again as quickly as possible. Any subsequent groups were disregarded for expediency and because of the error in estimation and low reliability of the method.
(4) The proportion of stone artifacts in the polygon estimated to meet the description of C1 is entered in the field labeled "C1% of Locus," and an estimate is also generated for category 2.
The method works for a rapid inventory, and it provides a general estimation of materials along with the characteristics and densities within loci. Using this system, archaeologists are encouraged to describe the variability between category 1 and 2 in terms of only one variable at a time. For example, if there were notable differences in both Material Type and Debitage Size in a particular locus, then a second polygon was created. Alternatively, the first polygon was copied, and the different "axes" of variability were distinguished independently. Instant types (i.e., attribute categories) were generated for each polygon by emphasizing the greatest variability within the locus, and this was considerably more spatially explicit than rapid archaeological survey had been in the past despite a relatively small investment in time. Time efficiency was a major objective of the Colca Survey with recording all but the very highest density lithic concentrations, and this approach allowed for rapid feature mapping. A variety of new possibilities for custom field applications are becoming available now that modern digital equipment, such as the mobile GIS used in this archaeological survey, can be modified and streamlined by the archaeologists to suit the needs of research without recourse to professional programmers.


