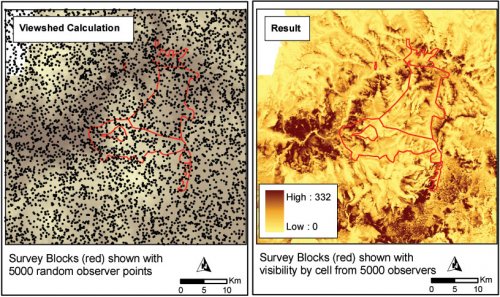
Procedure used in generating the mean Viewshed layer
(1) Defined the extent of the study area as 50 x 50 km square (2500 km2) that includes a buffer of at least 5 km around the Upper Colca Project survey blocks in order to eliminate edge effects.
(2) Five thousand points were generated using the pseudo-random point placement function in "Hawth's Tools 9" tool for ArcGIS 9. This produced approximately 2 observer points per kilometer in the viewshed study area. These points were converted to the Arc/info Coverage format.
(3) An observation target height of 1.5m (OFFSETB) and maximum distance of 10km (RADIUS2) were used.
4. The 30m resolution ASTER DEM was smoothed using FocalStatistics with a 3m kernel and converted to GRID.
5. The ArcWorkstation GRID command VISIBILITY was issued with the FREQUENCY flag which tallies the frequency at each location (this is, effectively, a cumulative viewshed analysis). Each view calculation took approximately 80 seconds on a P4 computer, for a total of 111 hours (4.6 days) of calculation.
Figure 5-12. Cumulative Viewshed using 5000 random observers and 10 km viewing distance.

